
- 1 Introduction
- 2 VIA C4
- 3 Context
Introduction
The purpose of this article is to give you inspiration how to document the design of your system.
Throughout many semester projects I have seen students being unsure which diagrams are needed, how to do them, where to put them. Basically, how best to explain how your system is put together.
This article takes heavy inspiration from the C4 model for visualising software architecture, but I have adjusted certain things, to make it fit better to our projects. The overall idea is the same, though.
The point is that you can create diagrams of your system at different levels of abstraction.
Consider the class diagram, it is detailed, but may become very large and incomprehensive, if you don't have some prior understanding of where to start looking at the diagram.
Here, different abstractions, and conventions, can really help the reader.
Instead of presenting the class diagram first, it is better to first give the reader a high level overview of the system. Is it a single-user desktop app? Is it client-server? Are there multiple servers?
So, different levels display different relevant information about the system. Usually it is best to start at high levels, zoomed out, and then gradually zoom in with more detailed diagrams.
This article will give examples of the various levels.
C4 Real Quick
The C4 model is named so, because it contains four types of diagrams, at four levels of abstraction:
- Context
- Containers
- Components
- Code
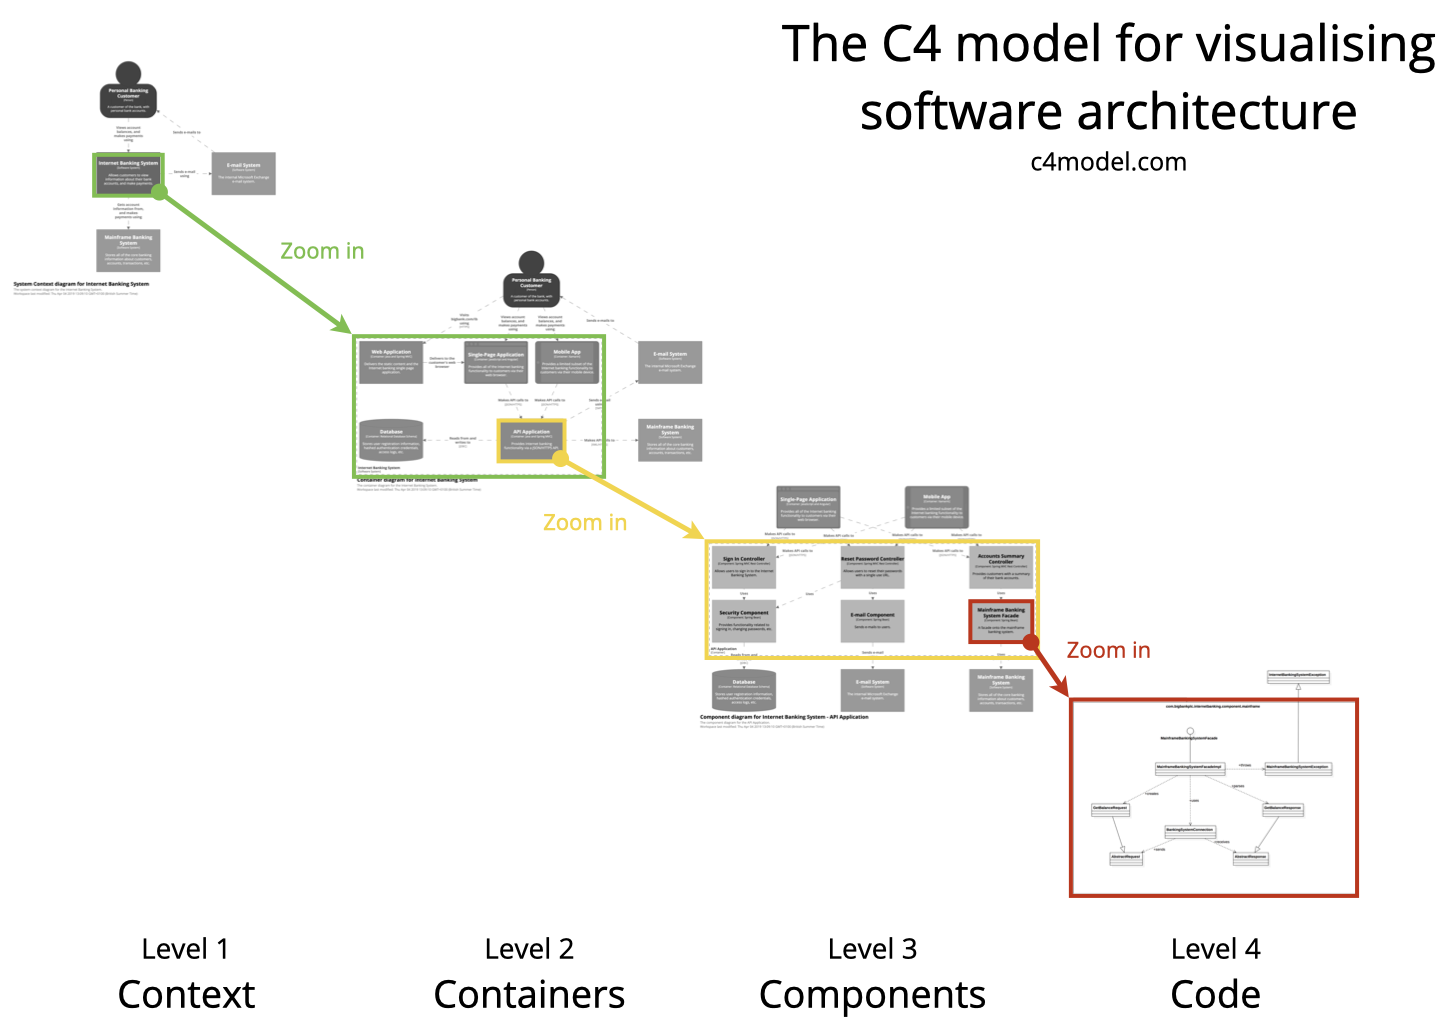
I realize you can't read the text, but the point remains: You have four levels, and can gradually zoom in, using different diagrams.
1 Context
This is the highest abstraction, it is sort of like a domain model, or a rich picture.
It provides a starting point, showing how the software system in scope fits into the world around it.
2 Container
This diagram zooms into the software system in scope, showing the high-level technical building blocks.
Here you will find the various applications and data stores. E.g. in a client-server system, this diagram would show client, server, and data, with connections between them.
3 Component
Applications are often composed of multiple components. We don't practice this very much at VIA, but a component can be considered a module in Java (or a JAR file), and a project in C# (or exe or dll file).
4 Code
This is your class diagram. Either one large, or by application (client, server, etc). Sometimes by component, but then you do risk the diagram becoming too fragmented to provide value.
Often this diagram is the one, which changes most often, and will involve the most work to keep updated.
VIA C4 Version
The next few slides will explain a version of C4 adapted to your projects, with examples.
I will introduce an extra level of abstraction.
Also realize not all diagram-levels are always relevant for your particular system. This article will provide tools and guidelines, and you must then apply what you feel is relevant in your project.
But, generally, you should remember to easy your reader into the system design.
I will provide examples of the same four levels, and I have a suggestion for a level 3.5 and 3.8, i.e. two extra levels.
These are "package diagram" and "low detailed class diagram".
This results in 6 levels of abstractions, again, not all are always relevant. And not all need go into the project report.
1 Context
2 Containers
3 Components
3.5 Packages
3.8 Low detailed class diagram
4 Code
Example system
To give examples of the diagrams, we need an example system. This will be a task management system, let's say it is to be used with some variation of Scrum. I will make it simpler for this example though.
You would therefore have different user roles: Product Owner, Developer.
We need a Project, which has a Product Backlog, containing User Stories.
We need Sprints, which has User Stories, and Sub-Tasks.
Let's give it a try, and go through each of the diagrams.
Context
The context sets the scene of the system, introduces the domain.
I feel this belongs more in the analysis part of your report, as it is closer to a domain model or a rich picture.
At some point, we introduced rich pictures on 3rd semester, and this picture could provide context.
I find these pictures are not always easy to draw, because software is somewhat abstract, and be difficult to explain with pictures. Maybe I just need practices. And some domains are more easily depicted than others.
There are no specific rules as to how you draw this, and you can google many different styles.
Below is an example of the task management system: